top of page

PRODUCTION
Feeding the world in a sustainable way is one of our most pressing challenges in the coming decades. Meat plays a pivotal role in this. Global meat consumption has increased rapidly over the past 50 years – It has been estimated that global meat consumption may double from 2000 to 2050.
YOUR CHOICE
Do you know how many green house gases went into your plate?
EMISSION
Compared to the other food, the production of meat has large environmental impacts, among which, the most severe one is increasing greenhouse gas emissions.
ENERGY EFFICIENCY
Meat takes much more grain, land and water to fatten an animal to produce a pound of meat than it does to grow the same number of calories in the form of grain that is eaten directly.
Everyone's diet matters to our planet.
Do you know how many greenhouse gases went into your plate?
Select the food you had today, hover on the chart to see more details.


QI
An AR app visualizing indoor comfort data
Achievement
The project is currently selected and developed in Harvard ilab venture incubation program (VIP program)
My Role Team member: Ao Li
UX Design | Prototyping | User Test
Duration
On-going
Toolkit
Figma | Principle | Adobe Suites
Unity | Rhino3d | Grasshopper C#
Overview
Do you know people spend 90% of their lifetime being indoors?
Do you know how to choose the most comfortable room to live in?
Do you know which window you should close to prevent ash building up in the room?
...
Project Vision
Scientific research shows that a comfortable indoor climate can increase the work productivity of the residents, improve their quality of life, lower the rates of illnesses. We vision to build an AR application to empower ( potential ) tenants to gain indoor comfort information in an accurate and intuitive way.
Research Phase
Paper review | Survey( N=36) | Interview
The indoor environment (temperature, light, airflow) determines human comfort and long-term health, physically and mentally. Theoretically, it should be one of the critical considerations for house finding and furniture layout.
However, the indoor environment is not easily observable or quantifiable.
During house finding, more than 2/3 of people's understanding of the indoor environment mainly comes from the description and advertisement of the landlord.
When asked about criteria for furniture layout, nearly all people answered " According to subjective aesthetics"
Research
Rather than subjective information, is there any objective information suggesting how everyday indoor climate might be like? Yes, of course! Check those numbers and arrows. Though they describe the weather outside, through openings on the building facade, they are positively correlated with indoor climate.
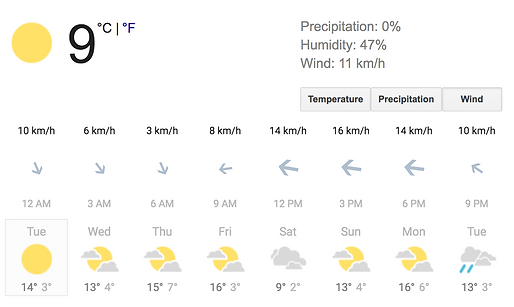
But can tenants better understand indoor climate and improve room comfort level according to it? Well..maybe not.
The missing spatial context is hindering people's understanding of numeric environmental data
Define Product
Define Product
The product vision to help ( potential ) tenants better understand indoor climate and improve the indoor comfort level
Technology involved: Augmented Reality | Location-Aware | Weather Database API | Real-time Energy Simulation
Steps
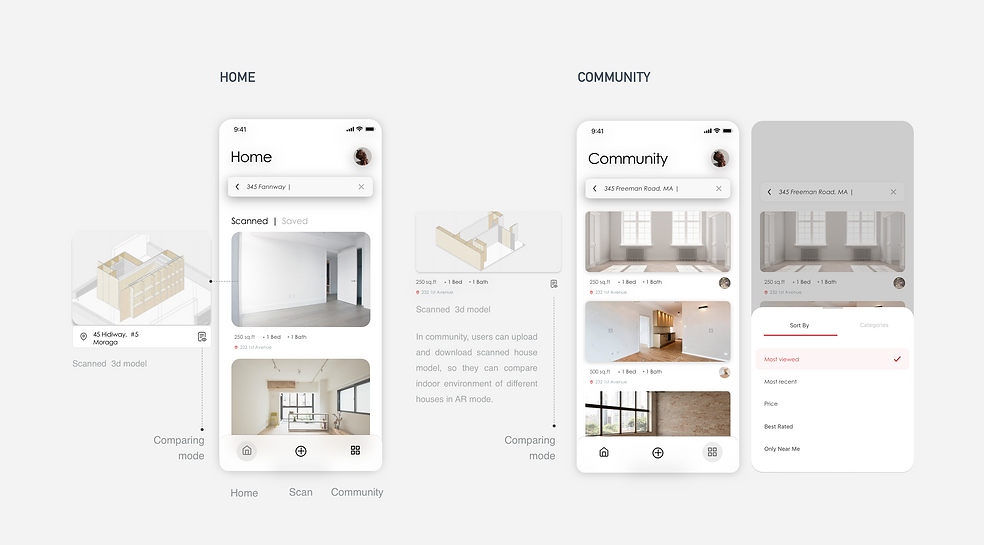
1) Scan a room to create floor plans, anchor openings (doors/ windows), and capture space properties (Location/ orientation/ area)
2) Connect to weather database API (Prevailing wind direction in all seasons, Daylight autonomy, Air temperature) and run real-time energy simulation based on space properties
3) Visualize simulated results - indoor climate data ( Ventilation, Daylight, and Temperature )
-
Ventilation
-
Daylight
-
Temperature
4) Upload spatial data to the cloud and create 3d indoor climate database, so users can compare multiple room models (in a smaller scale) at the same time.

Most people will feel comfortable at room temperature, colloquially a range of temperatures around 20 to 22 °C
"You have so many windows, according to the temperature visualization, your room will stay below 22°C before June. You don't need air conditioning to cool it down "


If the result shows clear cross ventilation, this area has good airflow; A corner with turbulence means ashes might building up here.
"According to Spring prevailing wind and the position of your room's window, if you open them all, you would have turbulence at that corner. Don't put your bed or closet there"
If the result is larger than 2000lux, the area has a potential of glare.
"June to August 4-7PM, next to this window, luminance is always larger than 2000lux. You might not want to put your working desk under this window "
Tech Analysis
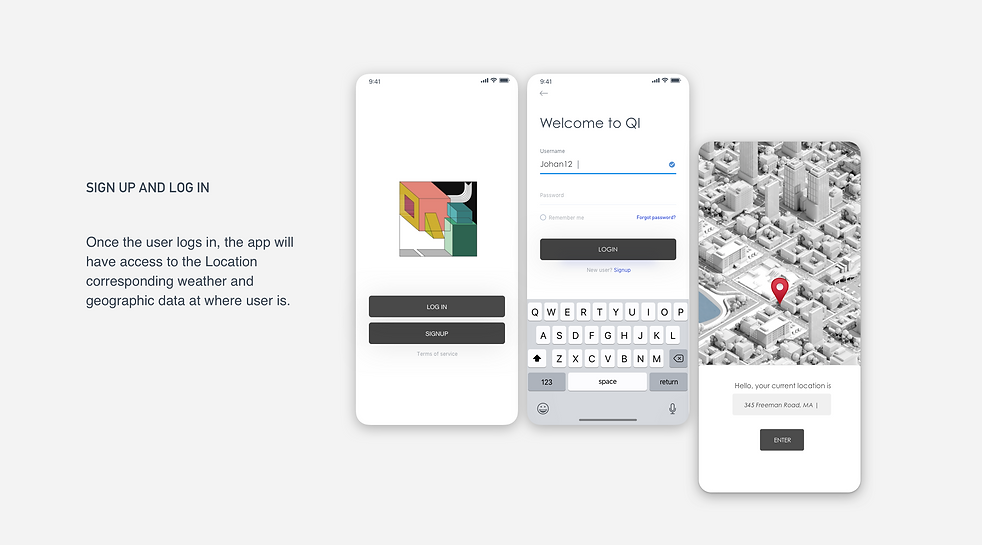
The product is adopting location-aware technology, then connects to the historical weather database geographically. Once enter the application, users can scan the space using the camera of their device, and generate a 3d model of the space. Based on the geometry, fast energy simulation will start running backstage, the result will be presented to the user in the form of augmented reality.
Tech Analysis
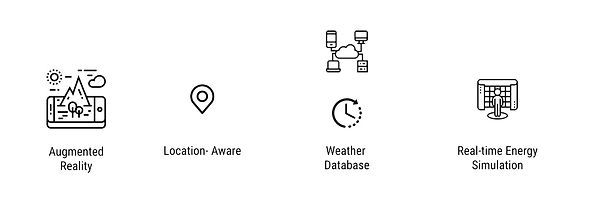
After doing the research, we found out that there are existing applications in the market that successfully using each one of these technologies.
The location-aware technology already has a high level of maturity and has been widely used in almost all of the geo-location related applications, applications like google-map can even associate 3d geometries with locations. Using the device camera to scan the space has been applied to applications like Magic Plan, in which a user can scan the space by adding nodes while scanning and get the 3d geometry of the scanned space.
For the energy simulation part, since we are facing the general public, there’s no need for professional accurate simulation which often takes a long time to calculate. What we need are some fast computation algorithms which have existed in some desktop software aiming at non-engineer background people to get fast feedback. That software includes Flow Design—A virtual wind tunnel simulator, Enscape---a rendering engine embedded with a fast illuminance simulator. There are also mobile apps like Aerodynamics Tools on Google Play that can do fast CFD simulation on mobile devices.
AR technology, which is the core feature for our product, has already been successfully applied to countless applications and it’s highly mature for the purpose of our product.
QI
Desgn Outcome
In traditional Asian culture, qi (or chi) is believed to be a vital force forming part of any living entity. Qi translates figuratively as "material energy" or "life force"
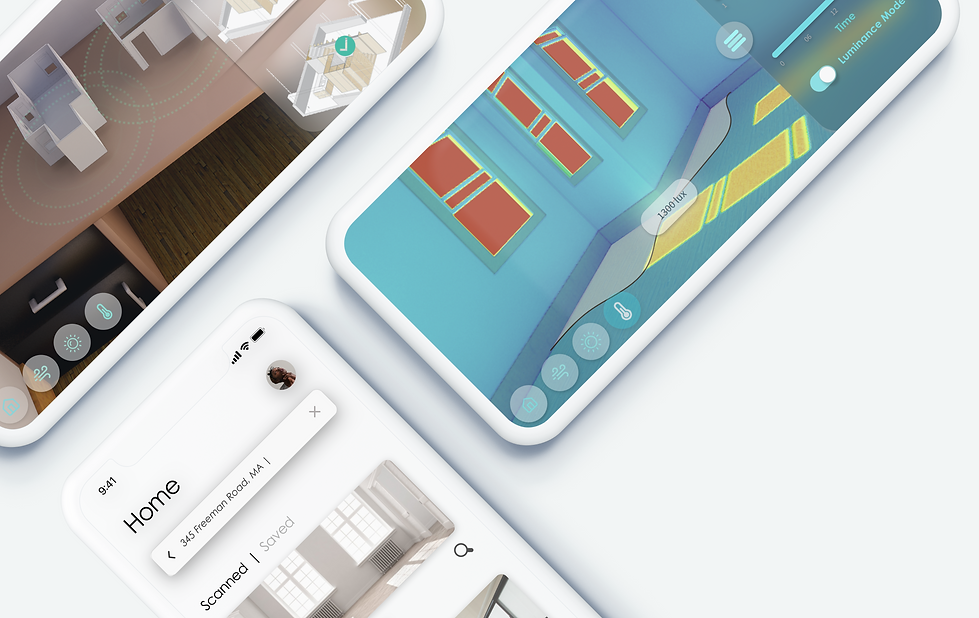
QI is an AR app that visualizes the building indoor environment and helps (potential) tenants make informed decisions during house finding, room managing, and furniture layout.


Wind (Ventilation)
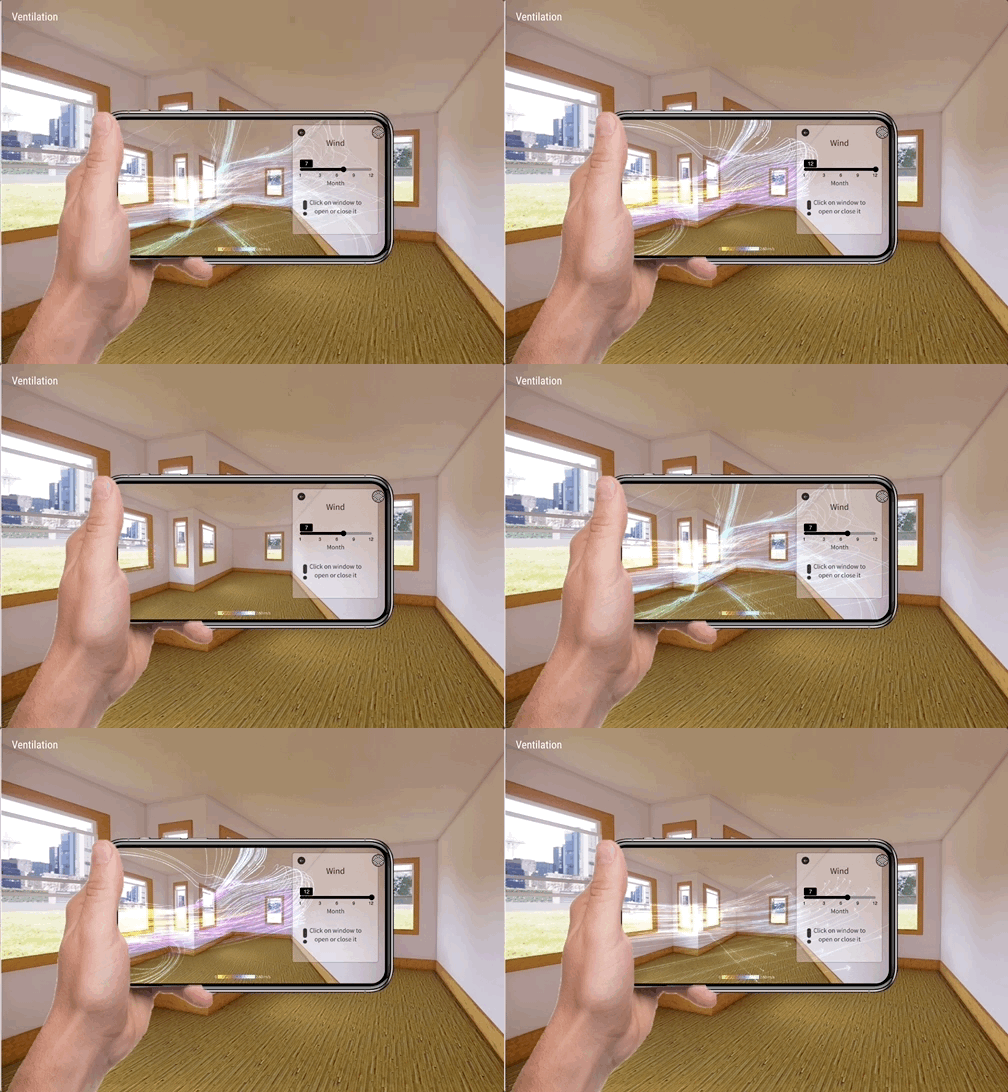
Natural ventilation visualization allows the user to inspect the ventilation quality of the room by visualizing the flow lines in different months, spotting turbulence and stagnation area.
Light (Glare)
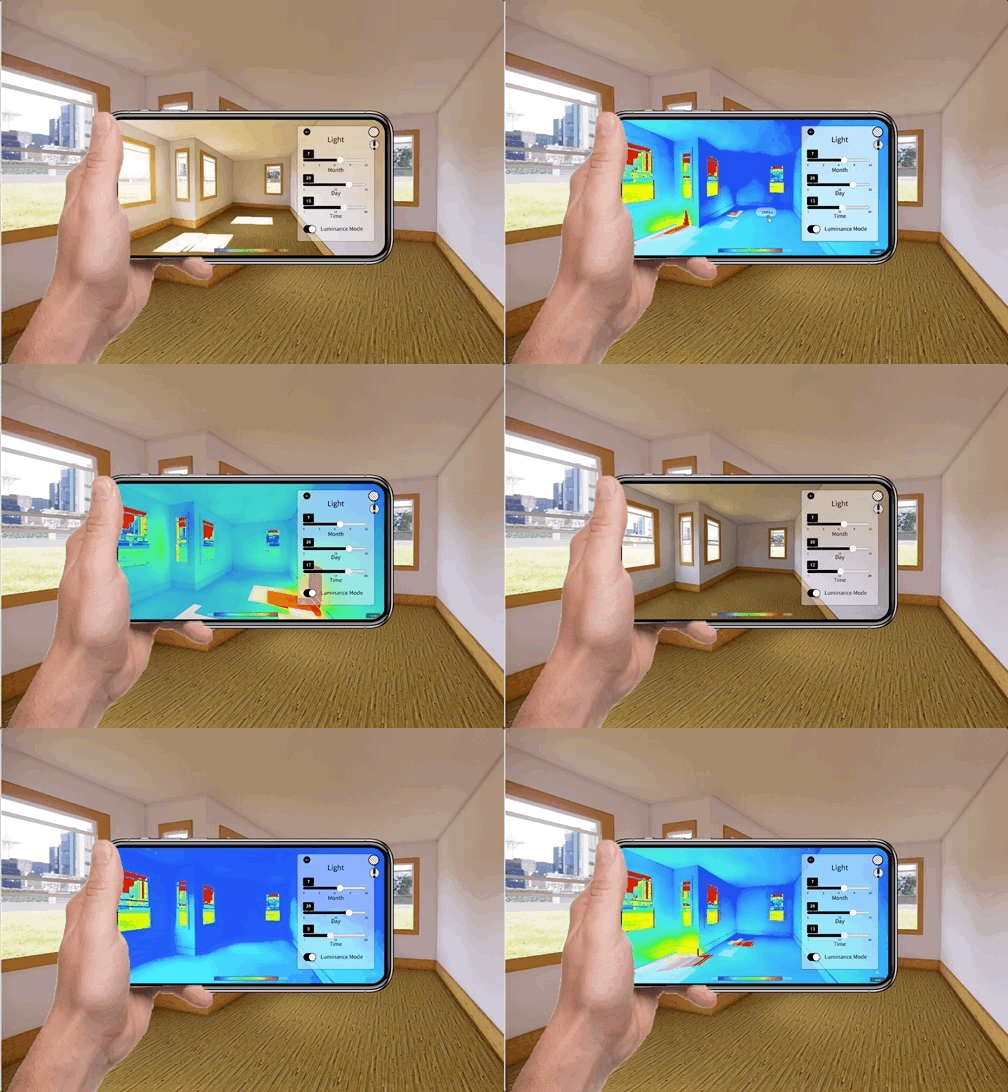
Light visualization informs the user of the dynamics of natural daylight, illuminance level and potential glare area throughout the year. Users can toggle on the Illuminance mode, where they can inspect exact surface illuminance. There’s also an overlay of potential glare or overheating area to give you more in-depth information about the lighting environment.
Temperature (Heat)
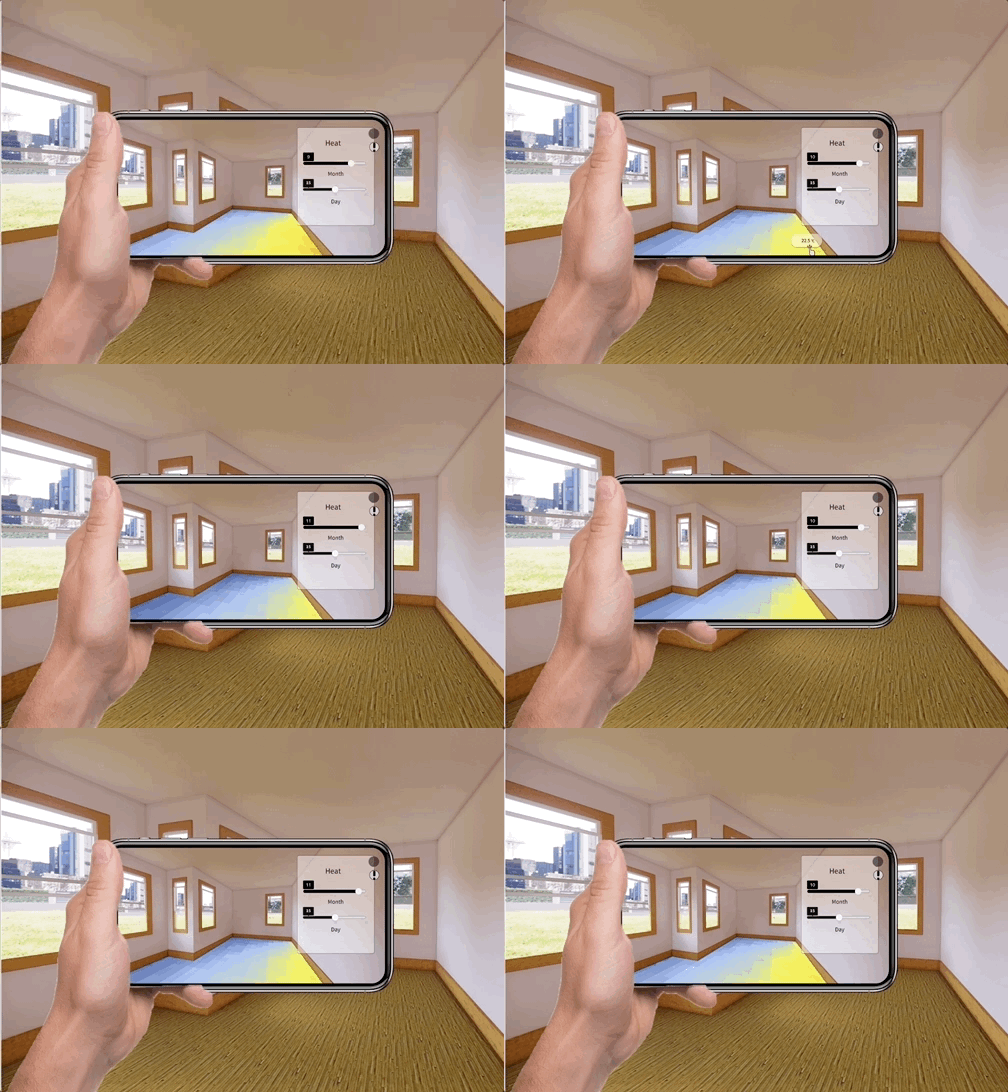
Heat distribution visualization allows the user to see how the Mean Radiant Temperature changes with time by giving metric at any given time how cold or hot the human body will feel in this space, especially in the extreme weather days.

Process
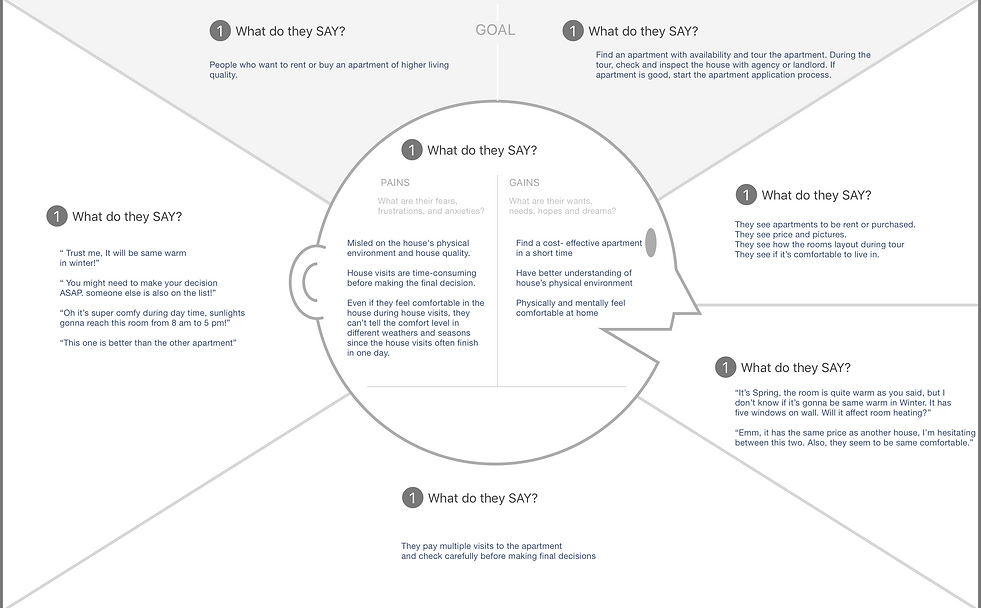
Empathy Map
Based on our research, we built an empathy map for our target user and summarized their pains and gains
Process
Journey Map
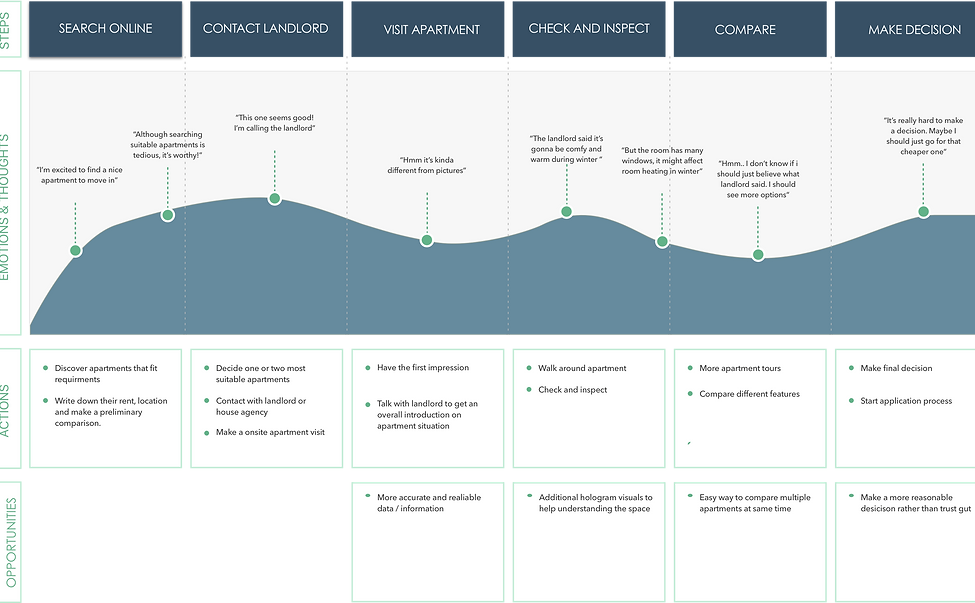
Storyboard
Storyboards are developed to demonstrate not only the details of a specific interface but also higher-level concepts surrounding user motivation and emotion

User Flow


bottom of page